Table of contents
- Descriptive vs Inferential Statistics Definition
- Understanding Population vs Sample
- Descriptive Statistics: Methods and Measures
- Inferential Statistics: Methods and Techniques
- Descriptive vs Inferential Statistics Examples
- Descriptive vs Inferential Statistics Difference: Key Comparisons
- When to Use Descriptive vs Inferential Statistics
- Common Misconceptions About Descriptive and Inferential Statistics
- Conclusion
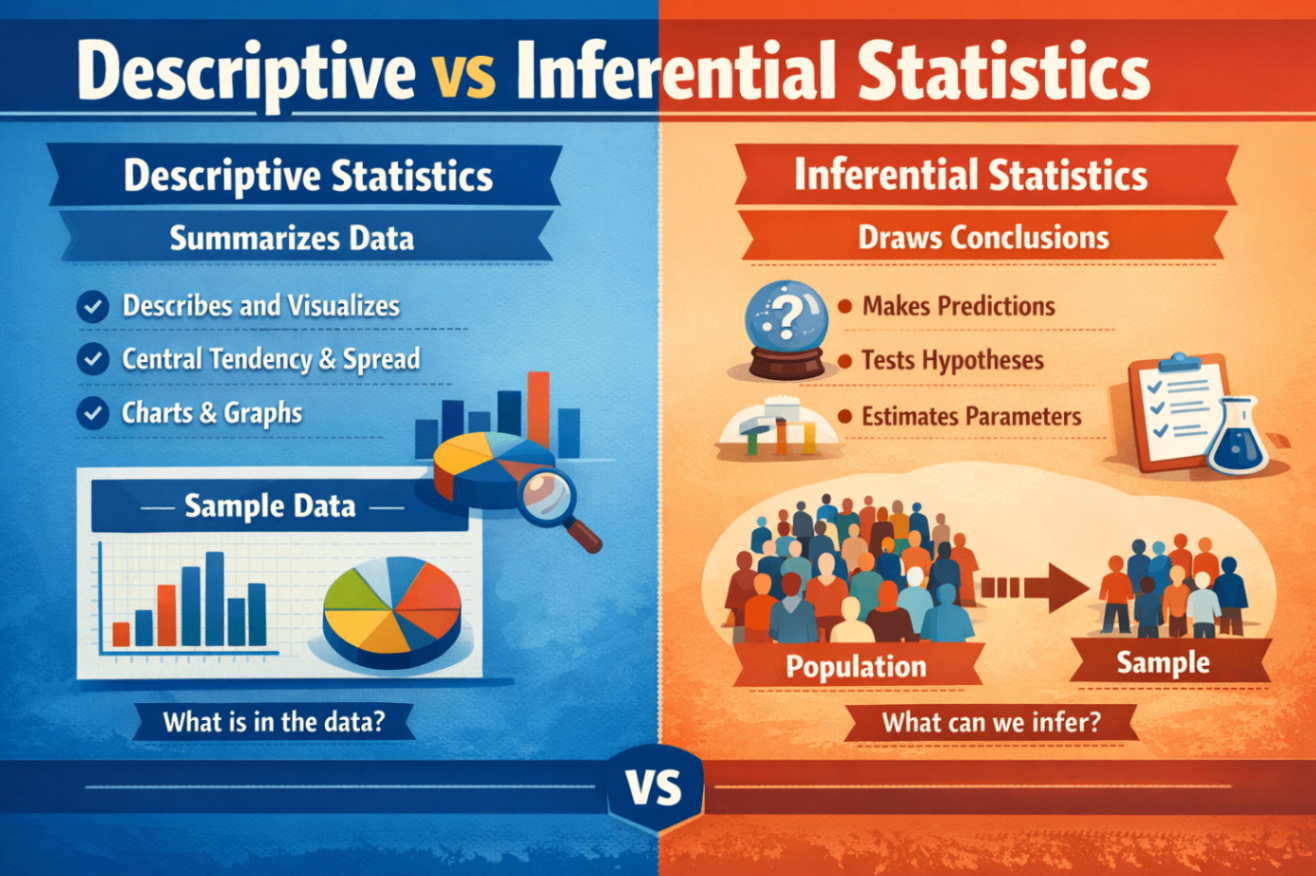
Statistics forms the backbone of data analysis, enabling researchers, analysts, and decision-makers to extract meaningful insights from information. Whether examining patient health records, analyzing business performance, or conducting scientific research, understanding the distinction between descriptive and inferential statistics proves essential for anyone working with data. These two fundamental branches of statistics serve different purposes yet work together to provide comprehensive understanding of datasets and the populations they represent. The difference between descriptive statistics vs inferential statistics centers on their distinct objectives and applications. Descriptive statistics summarize and present data you've collected, describing what the information shows through measures like averages, percentages, and visual representations. Inferential statistics extend beyond your immediate dataset, using sample information to make predictions and draw conclusions about larger populations. This comprehensive guide explores both statistical approaches, examining their definitions, methods, applications, and the critical differences that determine when to use each approach for optimal data analysis.
Descriptive vs Inferential Statistics Definition
Understanding the fundamental definitions of these statistical approaches provides the foundation for knowing when and how to apply each methodology effectively.
What Is Descriptive Statistics
Descriptive statistics is the term given to the analysis of data that helps describe, show or summarize data in a meaningful way such that patterns might emerge from the data. This branch focuses on organizing, summarizing, and presenting data in formats that make information accessible and understandable without extending conclusions beyond the collected data itself. Descriptive statistics do not allow us to make conclusions beyond the data we have analyzed or reach conclusions regarding any hypotheses we might have made—they simply describe the data at hand. When you calculate the average test score of students in a classroom or create a chart showing monthly sales figures, you're using descriptive statistics to present facts about the specific dataset you've collected.
What Is Inferential Statistics
Inferential statistics are techniques that allow us to use samples to make generalizations about the populations from which the samples were drawn. This statistical branch extends analysis beyond the immediate data, using probability theory and sampling methods to draw conclusions about larger groups based on smaller representative samples. The key characteristic of inferential statistics involves making predictions or inferences that extend beyond available data, accounting for uncertainty and providing confidence levels for conclusions. When medical researchers test a new drug on 500 patients and use those results to predict effectiveness for all future patients, they're applying inferential statistics to extend sample findings to broader populations.
The Core Distinction
The key difference between descriptive and inferential statistics is that descriptive statistics don't make inferences about broader populations, whereas inferential statistics serve precisely this purpose. Descriptive statistics state facts and proven outcomes from collected data, while inferential statistics analyze samples to make predictions about larger populations from which those samples originated.
Understanding Population vs Sample
Before delving deeper into statistical approaches, grasping the distinction between populations and samples proves crucial for understanding how each type of statistics operates.
Defining Population
A population in statistics includes the complete dataset for a particular problem—the entire group about which you want to draw conclusions. If studying average adult height in the United States, the population would comprise every adult in the country. Properties of populations, like means or standard deviations, are called parameters since they represent complete group characteristics.
Defining Sample
A sample is a smaller, specific group that resides within and represents the larger population. Instead of collecting data from entire populations—often impractical or impossible—researchers gather information from carefully selected samples that accurately reflect population characteristics. Properties of samples, such as means or standard deviations, are called statistics rather than parameters.
Why Sampling Matters
It's not feasible to measure all individuals in most populations, so representative samples become essential for research and analysis. For example, if you're interested in exam marks of all UK students, you cannot practically measure every student's performance, so you'd collect data from a representative sample (perhaps 1,000 students) used to represent the larger population. The accuracy of inferential statistics depends heavily on how well samples represent their populations. The process of ensuring accurate representation is called sampling, and proper sampling strategies—random selection, adequate sample size, and unbiased methods—determine whether conclusions drawn from samples validly apply to populations.
Descriptive Statistics: Methods and Measures
Descriptive statistics employ various methods to summarize and present data characteristics, making complex information digestible and interpretable.
Measures of Central Tendency
Central tendency describes the central position or typical value within a dataset. The mean (arithmetic average) represents the sum of all values divided by the number of observations, providing a balance point for the data. The median identifies the middle value when data is arranged in order, remaining unaffected by extreme outliers. The mode represents the most frequently occurring value in a dataset, useful for categorical data or identifying common responses. Understanding these measures helps characterize what's typical in your data. If analyzing employee salaries, the mean reveals average compensation, the median shows the middle salary unaffected by extremely high executive pay, and the mode identifies the most common salary level.
Measures of Variability
Variability measures describe how spread out or dispersed data values are around the central tendency. Range represents the difference between the highest and lowest values, providing a simple spread indicator. Variance calculates the average squared deviation from the mean, quantifying overall dispersion. Standard deviation, the square root of variance, expresses variability in the original data units, making interpretation more intuitive. These measures reveal data consistency and predictability. Low variability indicates values cluster tightly around the center, while high variability suggests widely scattered data. In quality control, low standard deviation in product measurements indicates consistent manufacturing, while high variability suggests inconsistent processes requiring attention.
Measures of Distribution
Distribution describes the frequency and pattern of different values throughout the dataset. Frequency distributions show how often each value or value range appears, often visualized through histograms. Skewness indicates whether data leans toward higher or lower values, while kurtosis measures whether distributions have heavy or light tails compared to normal distributions. Understanding distribution helps identify data patterns, outliers, and the overall shape of your dataset. Recognizing whether data follows normal distribution influences which analytical techniques are appropriate for further analysis.
Visual Representations
Descriptive statistics heavily rely on visual presentations that make patterns and relationships immediately apparent. Charts, graphs, and tables transform raw numbers into accessible formats. Common visualizations include bar charts for categorical comparisons, histograms for distribution visualization, pie charts for proportional representations, and scatter plots for relationship examination between variables. Effective visualizations communicate complex information quickly, revealing patterns that might remain hidden in raw data tables. When presenting business performance, visual dashboards displaying key metrics allow stakeholders to grasp results at a glance rather than parsing spreadsheets.
Inferential Statistics: Methods and Techniques
Inferential statistics employ sophisticated techniques to extend findings from samples to populations while accounting for uncertainty inherent in the sampling process.
Hypothesis Testing
Hypothesis testing represents a formal procedure for investigating ideas about populations using sample data. Researchers state null hypotheses (typically that no effect or difference exists) and alternative hypotheses (that an effect or difference does exist), then use statistical tests to determine which hypothesis the data supports. Common hypothesis tests include t-tests for comparing means between groups, chi-square tests for examining relationships between categorical variables, and ANOVA (Analysis of Variance) for comparing means across multiple groups. The t-test determines whether group differences likely occurred randomly by chance or systematically, indicating real differences.
Confidence Intervals
Confidence intervals provide ranges within which population parameters likely fall with specified certainty levels. Rather than stating a population mean equals a single value, confidence intervals acknowledge sampling uncertainty by providing a range—for example, stating with 95% confidence that the population mean falls between two values. These intervals quantify estimation uncertainty and provide confidence levels that the true population parameter falls within the specified range. Wider intervals indicate greater uncertainty, while narrower intervals suggest more precise estimates.
Regression and Correlation Analysis
Regression analysis examines relationships between variables, predicting how changes in independent variables affect dependent variables. Correlation analysis measures the strength and direction of relationships between two variables, expressed through correlation coefficients ranging from -1 (perfect negative correlation) to +1 (perfect positive correlation). These techniques help researchers understand whether variables move together and whether one variable can predict another. In business, regression might reveal how advertising spending affects sales, while correlation could show whether customer satisfaction relates to repeat purchases.
P-Values and Statistical Significance
P-values represent the probability of obtaining observed results (or more extreme results) if the null hypothesis were true. Small p-values (typically below 0.05) suggest observed effects are unlikely due to chance alone, providing evidence against the null hypothesis and supporting the alternative hypothesis. Statistical significance indicates when findings are unlikely to have occurred by random chance, lending credibility to conclusions drawn from sample data. However, statistical significance differs from practical significance—results can be statistically significant yet too small to matter in real-world applications. For students and professionals working through complex statistical analyses, tools like Statistics AI Solver can provide step-by-step guidance on calculations and concept clarification.
Descriptive vs Inferential Statistics Examples
Concrete examples illustrate how these statistical approaches apply in real-world scenarios across various fields.
Healthcare Example
In a hospital setting, descriptive statistics might summarize patient characteristics—calculating average patient age (45 years), the percentage of patients with diabetes (18%), the range of blood pressure readings (90/60 to 180/110 mmHg), and the most common diagnosis (hypertension). These statistics describe the current patient population without making broader claims. Inferential statistics in the same healthcare context might predict the likelihood of a patient developing diabetes based on age, blood pressure, and body mass index using regression analysis, or test whether a new medication reduces blood pressure more effectively than existing treatments through hypothesis testing with patient samples.
Education Example
A teacher using descriptive statistics might report that her class of 30 students scored an average of 78% on an exam, with scores ranging from 55% to 98%, standard deviation of 12 points, and a median score of 80%. These measures describe the specific class's performance without extending conclusions beyond those 30 students. If educational researchers wanted to determine whether a new teaching method improves student learning across all schools, they'd use inferential statistics. They might teach 500 students using the new method and 500 using traditional methods, then use hypothesis testing to determine whether observed differences likely extend to all students beyond their sample.
Business Example
A company's quarterly sales report employs descriptive statistics when it shows that average monthly revenue was 2 million dollars, sales increased 15% compared to the previous quarter, the most profitable product line was electronics, and sales ranged from 1.8 to 2.3 million monthly. These figures describe actual business performance during that specific period. The same company uses inferential statistics when predicting next quarter's sales based on current trends, determining whether customer satisfaction scores predict customer retention rates, or testing whether a new marketing campaign will increase sales across all customer segments based on results from a pilot test group.
Research Example
If a researcher surveys 100 college students about their study habits and reports that 65% study more than 10 hours weekly, the average student sleeps 6.5 hours nightly, and study locations vary with 40% preferring libraries, 35% studying in dorms, and 25% working in coffee shops—these descriptive statistics characterize the surveyed group. To make broader claims, the researcher would employ inferential statistics, perhaps testing whether psychology majors study significantly more hours than business majors (t-test), whether study time correlates with GPA (correlation analysis), or whether these findings from 100 students generalize to all college students nationwide (confidence intervals and hypothesis testing).
Descriptive vs Inferential Statistics Difference: Key Comparisons
Understanding the fundamental differences between these statistical approaches helps determine when each is appropriate for specific analytical needs.
Purpose and Objective
Descriptive statistics summarize and organize data to describe characteristics of collected information, focusing on what the data shows without extending conclusions beyond the dataset. Inferential statistics use sample data to make predictions, generalizations, or conclusions about larger populations from which samples were drawn, focusing on extending findings beyond immediate data.
Scope of Analysis
Descriptive analysis is limited to the data at hand—it describes only what's been collected without making broader claims. Inferential analysis extends beyond collected data to make probabilistic statements about populations, acknowledging that conclusions involve some uncertainty due to sampling variability.
Certainty Level
In descriptive statistics, there's no uncertainty—calculations precisely describe the collected data. The mean of a dataset is exactly what it is, no more or less. Inferential statistics always involve uncertainty since samples never perfectly represent populations, expressed through confidence intervals, p-values, and margins of error.
Complexity
Descriptive statistics tend to be simpler, involving straightforward calculations of means, medians, percentages, and basic visualizations that most people can understand with minimal statistical training. Inferential statistics are more complex, requiring understanding of probability theory, sampling distributions, hypothesis testing procedures, and statistical significance—concepts demanding more advanced statistical knowledge.
Questions Answered
Descriptive statistics answer "what" questions—What is the average? What proportion has this characteristic? What's the distribution? Inferential statistics answer "why" and "what if" questions—Why do groups differ? What's likely true for the population? What will probably happen in the future?
Examples of Use
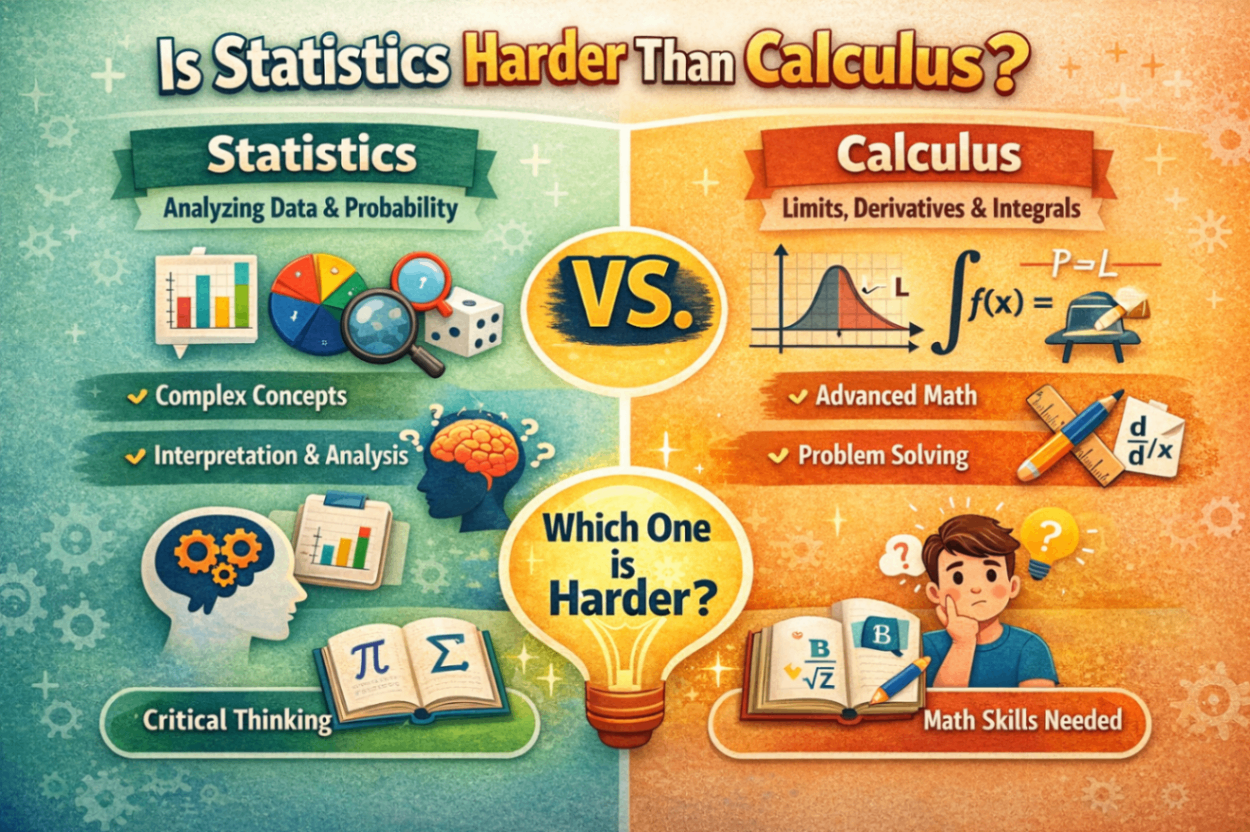
Descriptive statistics appear in dashboards, reports, and presentations that summarize current states—sales figures, demographic breakdowns, performance metrics. Inferential statistics drive research conclusions, policy decisions, and predictions—determining whether treatments work, forecasting election results, deciding whether business strategies succeed. Understanding is statistics harder than calculus helps contextualize the complexity involved in mastering both descriptive and inferential approaches.
When to Use Descriptive vs Inferential Statistics
Selecting the appropriate statistical approach depends on your research questions, data characteristics, and analytical objectives.
Use Descriptive Statistics When
Apply descriptive statistics when you need to understand or present your data as-is, such as creating dashboards or conducting initial exploratory data analysis. Use descriptive approaches when summarizing survey responses for a specific group, presenting business performance metrics for a particular period, or describing characteristics of your study participants. Descriptive statistics work well when you don't need to generalize beyond your data, when you're presenting information to non-technical audiences who need clear summaries, or when performing quality checks to understand data before conducting more advanced analyses. If your goal is simply showing what happened rather than predicting what will happen or testing theories, descriptive statistics suffice.
Use Inferential Statistics When
Choose inferential statistics when decisions involve uncertainty and require evidence-based conclusions extending beyond your immediate data. Use inferential approaches when testing whether observed differences between groups are statistically significant, making predictions about future outcomes based on current trends, or determining whether relationships between variables exist in broader populations. Inferential statistics become necessary when generalizing findings from samples to populations, when research requires testing hypotheses or theories, or when making decisions based on incomplete information about larger groups. If you need to know not just what your data shows but what it means for broader contexts, inferential statistics provide the necessary tools.
Using Both Approaches Together
Most comprehensive data analyses employ both approaches. Typically, analyses begin with descriptive statistics to understand data characteristics, identify patterns, check for errors, and summarize key features. After this foundation, inferential statistics extend the analysis to test hypotheses, make predictions, and draw broader conclusions. This combined approach leverages descriptive statistics' clarity and accessibility while gaining inferential statistics' predictive and explanatory power. Research reports commonly present descriptive statistics first to orient readers to the data, followed by inferential results that address research questions and test hypotheses.
Common Misconceptions About Descriptive and Inferential Statistics
Several misunderstandings persist about these statistical approaches, potentially leading to inappropriate applications or misinterpretations.
Misconception: Descriptive Statistics Are Less Important
Some view descriptive statistics as merely preliminary steps before "real" analysis begins. However, descriptive statistics provide essential foundations for all analyses, communicate findings effectively to diverse audiences, and often answer practical questions directly without requiring complex inference.
Misconception: Inferential Statistics Are Always More Sophisticated
While inferential techniques can be complex, sophistication doesn't guarantee appropriateness or value. Sometimes simple descriptive statistics provide exactly the information needed, while unnecessary inferential procedures complicate straightforward situations or make claims beyond what data support.
Misconception: Large Samples Eliminate the Need for Inference
Even with large samples, inferential statistics remain necessary when making claims about populations beyond those sampled. Large samples reduce sampling error but don't eliminate the conceptual distinction between samples and populations they represent.
Misconception: Statistical Significance Equals Practical Importance
Inferential statistics can show statistically significant results that lack practical significance. A tiny effect might achieve statistical significance with large samples but remain too small to matter in real-world applications. Always consider both statistical and practical significance when interpreting results.
Conclusion
Understanding descriptive vs inferential statistics represents fundamental knowledge for anyone working with data in research, business, healthcare, education, or any field requiring evidence-based decisions. Descriptive statistics summarize and present collected data through measures of central tendency, variability, and distribution, describing what information shows without extending claims beyond the dataset. Inferential statistics use sample data to make predictions, test hypotheses, and draw conclusions about larger populations through techniques like hypothesis testing, confidence intervals, and regression analysis. The difference between descriptive statistics vs inferential statistics centers on scope and purpose—descriptive approaches describe specific datasets with certainty, while inferential approaches extend findings to broader populations while acknowledging uncertainty. Most comprehensive analyses employ both approaches, beginning with descriptive summaries that establish foundations before proceeding to inferential procedures that test theories and make predictions. Whether creating business dashboards with descriptive statistics or conducting research studies using inferential methods, understanding when and how to apply each approach ensures accurate analysis, appropriate conclusions, and effective communication of data-driven insights that support sound decision-making across all domains.
Frequently Asked Questions
What is the main difference between descriptive and inferential statistics?
The main difference is that descriptive statistics summarize and describe characteristics of the data you've actually collected without making broader claims, while inferential statistics use sample data to make predictions, generalizations, and conclusions about larger populations from which the sample was drawn. Descriptive statistics tell you what your data shows with certainty, while inferential statistics help you determine what your data suggests about populations you haven't fully measured, always involving some level of uncertainty expressed through confidence intervals and p-values.
Can you use descriptive and inferential statistics together?
Yes, most comprehensive data analyses use both approaches together. Typically, analysis begins with descriptive statistics to summarize data characteristics, identify patterns, check for errors, and understand what the collected information shows. After this foundation, researchers apply inferential statistics to test hypotheses, examine relationships, make predictions, and draw conclusions that extend beyond the immediate dataset. This combined approach provides both clear data summaries and evidence-based conclusions about broader populations or future outcomes.
What are examples of descriptive statistics?
Common descriptive statistics examples include calculating the average age of survey respondents, reporting the percentage of customers who were satisfied with service, creating a bar chart showing monthly sales figures, determining the range of test scores in a classroom, finding the median household income in a city, or displaying the distribution of website visitors by country using a pie chart. These all describe characteristics of specific datasets without making predictions or claims about broader populations beyond the collected data.
What are examples of inferential statistics?
Inferential statistics examples include testing whether a new medication is more effective than existing treatments using hypothesis testing, predicting next quarter's sales based on historical trends through regression analysis, determining whether the difference in test scores between two teaching methods is statistically significant using t-tests, estimating with 95% confidence that the national average income falls within a specific range based on survey data, or examining whether customer satisfaction correlates with loyalty across all customers based on a sample survey.
When should I use descriptive versus inferential statistics?
Use descriptive statistics when you need to summarize, organize, and present data you've collected, such as creating reports, dashboards, or initial data explorations where your goal is showing what the data reveals about that specific group or period. Use inferential statistics when you need to make predictions, test hypotheses, or draw conclusions about populations beyond your sample, such as determining whether treatments work, forecasting future trends, testing theories, or making decisions based on incomplete information about larger groups. If you only need to know what your data shows, use descriptive; if you need to know what your data suggests about broader contexts, use inferential.