Table of contents
- What Is the Average SAT Score Nationally?
- Average SAT Score by State: Regional Variations
- Average SAT Score for Harvard and Elite Universities
- Average SAT Score 2025: Current Trends and Expectations
- The Average SAT Score in the US: National Context
- College-Specific Average SAT Scores
- Future Trends in SAT Scoring and College Admissions
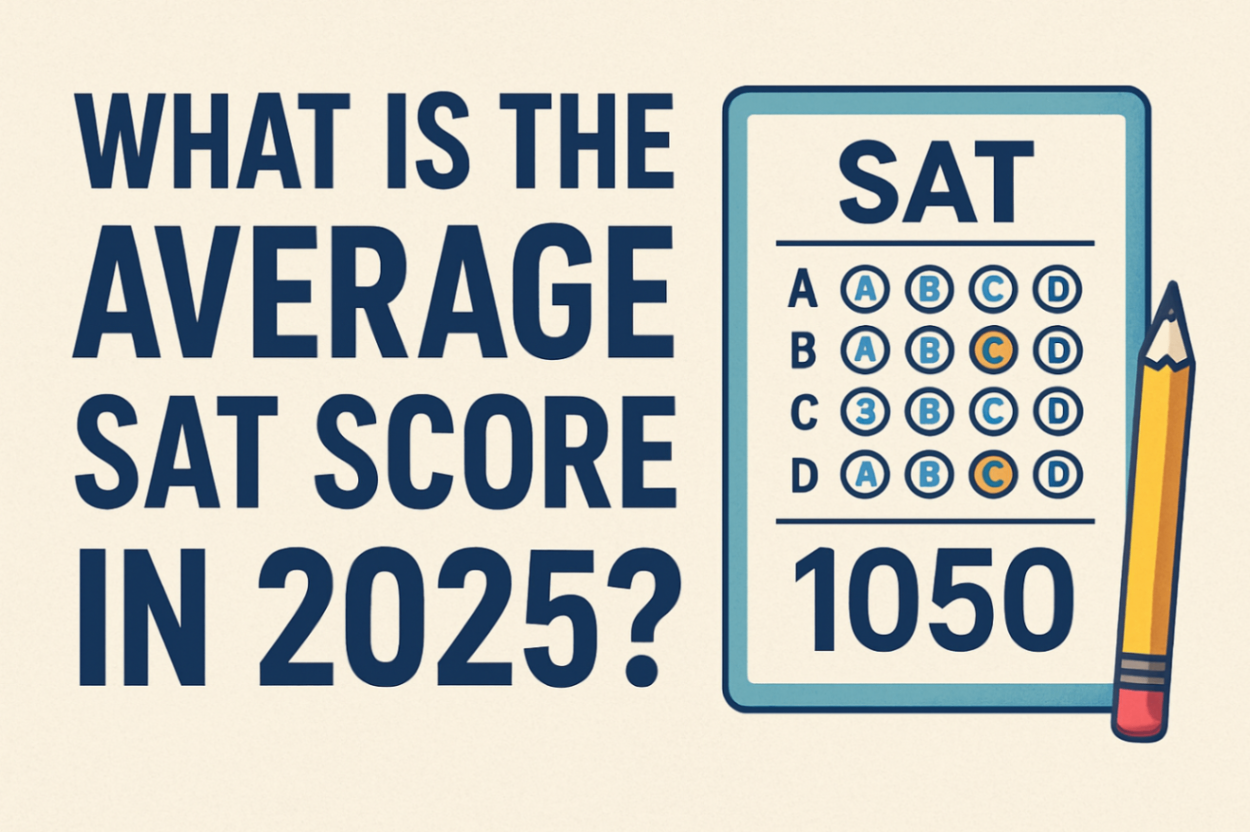
The SAT remains one of the most crucial components of college admissions, serving as a standardized benchmark for academic readiness across the United States. According to the College Board, the national average SAT score in 2024 was 1024, providing students with a clear baseline to measure their performance against. Understanding what is the average SAT score and how it compares to your target schools can significantly impact your college admission success.
Whether you're aiming to reach the national average or striving for scores that meet Ivy League standards, effective preparation is essential. Students looking to improve their performance can benefit from targeted practice tools like our SAT Solver, which provides comprehensive practice questions and detailed explanations to help boost your scores.
What Is the Average SAT Score Nationally?
The national average SAT score serves as the foundation for understanding where students stand academically. The average total SAT score was 1024 in 2024, which represents the lowest since the test changed formats in 2016. This score breaks down into two main sections:
- Evidence-Based Reading and Writing (ERW): 519 average score
- Mathematics: 505 average score
More than 1.97 million high school students took the SAT in 2024, making this a comprehensive representation of student performance across the nation. The SAT average score provides valuable context for students planning their college applications and academic goals.
Average SAT Score by State: Regional Variations
Understanding the average SAT score by state reveals significant regional differences in academic performance and testing participation. North Dakota boasts the highest average SAT score of 1287, but only 1% of eligible students took the exam, highlighting how participation rates can dramatically affect state averages.
Top-Performing States by SAT Average Score
States with the highest average score on SAT typically have lower participation rates, suggesting that only the most prepared students choose to take the exam in those regions. This pattern emerges because many students in these states opt for the ACT or attend colleges that don't require standardized testing.
Complete State-by-State SAT Score Breakdown
The following table provides a comprehensive overview of average SAT score by state, showing how testing policies and participation rates impact overall performance:
| State | SAT Required? | Number of Test Takers | Average Total Score | Average ERW Score | Average Math Score | 75th Percentile | 50th Percentile |
|---|---|---|---|---|---|---|---|
| Alabama | No | 1,517 | 1157 | 591 | 566 | 1320 | 1160 |
| Alaska | No | 2,625 | 1079 | 555 | 524 | 1200 | 1080 |
| Arizona | No | 8,367 | 1185 | 599 | 586 | 1330 | 1190 |
| Arkansas | No | 733 | 1188 | 612 | 575 | 1310 | 1190 |
| California | No | 120,205 | 1086 | 549 | 537 | 1280 | 1080 |
| Colorado | Yes | 58,078 | 998 | 510 | 488 | 1140 | 980 |
| Connecticut | Yes | 42,020 | 990 | 502 | 488 | 1150 | 960 |
| Delaware | Yes | 10,880 | 948 | 484 | 464 | 1080 | 910 |
| Florida | No | 229,784 | 948 | 493 | 455 | 1090 | 920 |
| Georgia | No | 69,136 | 1039 | 532 | 507 | 1180 | 1030 |
| Hawaii | No | 4,202 | 1124 | 570 | 554 | 1250 | 1120 |
| Idaho | No | 17,603 | 998 | 508 | 490 | 1130 | 990 |
| Illinois | No | 141,846 | 966 | 491 | 476 | 1110 | 940 |
| Indiana | Yes | 80,008 | 969 | 489 | 480 | 1100 | 950 |
| Iowa | No | 916 | 1195 | 606 | 589 | 1350 | 1210 |
| Kansas | No | 734 | 1256 | 633 | 623 | 1400 | 1260 |
| Kentucky | No | 962 | 1197 | 612 | 585 | 1350 | 1200 |
| Louisiana | No | 1,117 | 1195 | 611 | 584 | 1350 | 1210 |
| Maine | No | 5,545 | 1074 | 550 | 524 | 1190 | 1070 |
| Maryland | No | 52,851 | 998 | 512 | 487 | 1160 | 970 |
| Massachusetts | No | 43,398 | 1109 | 559 | 550 | 1270 | 1110 |
| Michigan | Yes | 103,396 | 965 | 492 | 473 | 1100 | 940 |
| Minnesota | No | 2,146 | 1215 | 608 | 607 | 1390 | 1240 |
| Mississippi | No | 382 | 1197 | 612 | 585 | 1330 | 1190 |
| Missouri | No | 2,190 | 1193 | 603 | 590 | 1360 | 1210 |
| Montana | No | 426 | 1204 | 613 | 592 | 1330 | 1210 |
| Nebraska | No | 320 | 1227 | 622 | 605 | 1370 | 1230 |
| Nevada | No | 2,028 | 1180 | 599 | 581 | 1320 | 1180 |
| New Hampshire | Yes | 12,327 | 1023 | 520 | 503 | 1160 | 1000 |
| New Jersey | No | 77,320 | 1050 | 531 | 519 | 1220 | 1040 |
| New Mexico | Yes | 23,071 | 885 | 453 | 431 | 980 | 850 |
| New York | No | 127,993 | 1035 | 522 | 513 | 1200 | 1020 |
| North Carolina | No | 23,495 | 1161 | 590 | 571 | 1290 | 1160 |
| North Dakota | No | 58 | 1287 | 624 | 605 | 1370 | 1290 |
| Ohio | Yes | 27,389 | 1025 | 516 | 509 | 1190 | 1010 |
| Oklahoma | No | 4,339 | 966 | 495 | 470 | 1120 | 930 |
| Oregon | No | 9,847 | 1117 | 572 | 546 | 1260 | 1120 |
| Pennsylvania | No | 67,012 | 1075 | 546 | 529 | 1220 | 1080 |
| Rhode Island | Yes | 11,275 | 954 | 488 | 465 | 1090 | 930 |
| South Carolina | No | 28,563 | 1015 | 521 | 494 | 1140 | 1000 |
| South Dakota | No | 150 | 1214 | 613 | 602 | 1310 | 1210 |
| Tennessee | Yes | 3,325 | 1191 | 607 | 584 | 1340 | 1200 |
| Texas | No | 291,694 | 971 | 495 | 477 | 1110 | 950 |
| Utah | No | 771 | 1230 | 622 | 609 | 1370 | 1250 |
| Vermont | No | 2,720 | 1097 | 562 | 535 | 1230 | 1090 |
| Virginia | No | 49,631 | 1101 | 564 | 537 | 1250 | 1100 |
| Washington | No | 29,189 | 1081 | 549 | 531 | 1260 | 1080 |
| West Virginia | Yes | 15,683 | 919 | 477 | 442 | 1040 | 900 |
| Wisconsin | No | 1,301 | 1221 | 610 | 610 | 1390 | 1240 |
| Wyoming | No | 84 | 1253 | 636 | 616 | 1390 | 1260 |
Impact of State Testing Policies
The data reveals clear patterns between state testing policies and SAT score average performance. States with mandatory testing typically show lower averages due to broader participation across all academic performance levels. For example:
- North Dakota leads with the highest average (1287) but only 58 test-takers
- Kansas follows with 1256 average from just 734 students
- Wyoming achieves 1253 with only 84 participants
Conversely, states requiring the SAT show more moderate averages:
- Colorado (mandatory): 998 average with 58,078 test-takers
- Connecticut (mandatory): 990 average with 42,020 participants
- New Mexico (mandatory): 885 average with 23,071 students
This pattern demonstrates how participation rates significantly influence state-by-state average SAT score comparisons.
Average SAT Score for Harvard and Elite Universities
When discussing the average SAT score for Harvard, we enter the realm of highly competitive admissions. The typical SAT composite score range for accepted students lies between 1500 and 1580, with an average SAT score for Harvard around 1550. This Harvard average SAT score represents the 25th to 75th percentile range, demonstrating the exceptional academic caliber required for admission.
Understanding Harvard's SAT Requirements
While there is technically no minimum SAT score to get into Harvard, you'll likely need a score of around 1500 or higher to be competitive. The average SAT score for Harvard reflects the institution's commitment to admitting students who can excel in rigorous academic environments.
Average SAT Score for Ivy League Schools
The average SAT score for ivy league institutions typically ranges from 1480 to 1580, with most schools requiring scores well above the national average. Harvard and Yale report the highest SAT scores, with very similar ranges; Harvard's middle range is between 1480 and 1580, while Yale's is between 1470 and 1580.
Ivy League Testing Policy Changes
All of the Ivies, except for Columbia and Princeton, have all reinstated SAT or ACT requirements for upcoming admissions cycles. This shift emphasizes the continued importance of achieving a competitive average SAT score that meets Ivy League standards.
Strategic Approach to Ivy League Applications
For most Ivy League hopefuls, that means targeting at least a 1500. A 1450 might be within range, but it won't necessarily set you apart, especially if other areas of your application are weaker. Understanding what average SAT score expectations are helps students set realistic goals.
Average SAT Score 2025: Current Trends and Expectations
The average SAT score 2025 continues to reflect the changing landscape of standardized testing. According to the most recent College Board data, the average SAT score for 2024 is 1024 (out of 1600), and this baseline provides context for what constitutes a competitive score.
Digital SAT Impact on Scoring
In March 2024, the SAT went fully digital, and it got shorter. The paper test lasted three hours, but the digital offering lasts two hours. This transition to digital testing has maintained the same scoring scale while potentially improving the testing experience.
What Constitutes a Good SAT Score?
Understanding what is the average SAT score helps establish what constitutes a "good" score. Any score above this threshold can be considered a good score, as it means you've done better than the majority of test takers. However, the definition of "good" varies significantly based on your target colleges.
Percentile Rankings and Score Interpretation
Scores in the 50th percentile (1030) are average, while scores in the 75th percentile (1200) and 90th percentile (1360) are good and excellent, respectively. These percentile rankings provide better context than the raw average score for SAT when evaluating performance.
The Average SAT Score in the US: National Context
The average SAT score in the US reflects the diverse educational landscape across different regions and demographics. The average total SAT score was 1024 in 2024, and a score of 1350 ranks among the top 10% of all test takers. This national context helps students understand their competitive position.
Factors Affecting National Averages
Several factors influence the average SAT score in the US:
- Participation rates: States with higher participation often show lower averages
- Educational resources: Access to quality preparation materials and instruction
- Socioeconomic factors: Family income and parental education levels
- Regional testing preferences: Some areas favor the ACT over the SAT
College-Specific Average SAT Scores
Different types of institutions have varying average score on SAT expectations:
State Universities and Public Colleges
Public universities and state colleges generally consider SAT scores between 900 and 1100 to be competitive, although this may depend on how selective the school is. These institutions often have more accessible admission requirements than elite private schools.
Highly Selective Private Universities
Elite private universities typically require scores well above the SAT average score. Highly competitive institutions often require scores above 1400, while moderately selective schools range between 1000 and 1400.
Financial Aid and Merit Scholarships
Understanding the average SAT score for your target schools becomes crucial for financial planning. Many merit-based scholarships still use SAT scores as a major factor, even at schools where the test is optional for admission. Higher scores can translate to significant financial benefits.
Scholarship Thresholds
Many institutions offer guaranteed merit scholarships based on SAT scores:
- Scores above 1400 often qualify for substantial scholarships
- Perfect or near-perfect scores may result in full-tuition awards
- State flagship universities frequently tie aid to standardized test performance
Future Trends in SAT Scoring and College Admissions
The landscape of standardized testing continues to evolve, with implications for average SAT score 2025 and beyond. These changes are backed by their own internal reviews, which show that test scores actually help level the playing field.
Test-Optional Policy Reversals
According to Yale, omitting scores put high-achieving students from lower-income backgrounds at a disadvantage. This recognition has led many institutions to reinstate testing requirements, making understanding of average SAT score expectations more critical than ever.
Conclusion: Making Sense of Average SAT Scores
The average SAT score serves as more than just a statistical benchmark—it represents academic preparation and college readiness across the United States. With the national average SAT score at 1024, students have a clear baseline for measuring their performance and setting realistic goals.
Whether you're aiming for the average SAT score for Harvard of around 1550 or seeking to exceed the average SAT score for ivy league schools, understanding these benchmarks is crucial for strategic college planning. The key lies not just in achieving these scores, but in developing the academic skills and knowledge they represent.
Remember that while SAT scores are important, they represent just one component of your college application. Combine strong test performance with excellent grades, meaningful extracurricular activities, and compelling essays to create a well-rounded application that stands out to admission committees.
As testing policies continue to evolve and average SAT score 2025 trends emerge, staying informed about these changes will help you make the best decisions for your academic future. Focus on thorough preparation, realistic goal-setting, and understanding how your scores fit within the broader context of your educational aspirations.
Frequently Asked Questions
What is the average SAT score in 2025?
The national average SAT score for 2025 is 1024 out of 1600. This score is calculated from the performance of nearly 2 million students who took the test. The average breaks down to 519 for Evidence-Based Reading and Writing and 505 for Mathematics. This benchmark helps students understand where they stand compared to their peers nationwide.
What is a good SAT score for Ivy League schools?
A competitive SAT score for Ivy League schools typically ranges from 1500 to 1580. Most Ivy League institutions expect scores in the 75th percentile or higher, which means aiming for at least 1550 for the best chances. Harvard and Yale report the highest average scores, with middle 50% ranges between 1470-1580. While a 1450 might be within range, scores closer to 1550 significantly strengthen your application.
How do average SAT scores vary by state?
Average SAT scores by state vary dramatically, ranging from 885 in New Mexico to 1287 in North Dakota. States with lower participation rates often show higher averages because only the most prepared students take the test. States requiring mandatory SAT testing typically show lower averages due to broader participation. For example, North Dakota has the highest average (1287) but only 58 test-takers, while Colorado (mandatory testing) averages 998 with over 58,000 participants.
What SAT score do I need for Harvard University?
While Harvard doesn't have a minimum SAT requirement, competitive applicants typically need scores around 1500 or higher. The Harvard average sat score for admitted students is approximately 1550, with the middle 50% range falling between 1500-1580. This means 25% of admitted students score below 1500 and 25% score above 1580. A score of 1500 places you at the 25th percentile, while 1580 puts you at the 75th percentile.
How can I improve my SAT score above the national average?
To score above the national average of 1024, focus on strategic preparation including diagnostic testing, targeted practice, and regular mock exams. Most students can improve their scores with dedicated preparation over 2-3 months. Key strategies include identifying weak areas, practicing time management, understanding the digital format, and taking multiple practice tests. Students can also use specialized tools like SAT prep courses or online resources to track progress and focus on specific question types that need improvement.